Overview
The Undergraduate Forestry Data Science (or, as we lovingly call it: “UFDS”) program is a joint collaboration between the US Forest Service Rocky Mountain Research Station, Forest Inventory and Analysis Program (FIA), Bucknell University, and Reed College that engages undergraduate students with authentically motivated research questions in statistics, data science, and forestry. The co-directors of the program are George Gaines (FIA), Kelly McConville (Bucknell), and Grayson White (Reed). In summer 2026, the UFDS program will be held at Reed College, but in the past the program has taken place at Whitman College, Swarthmore College, Reed College, Harvard University, and Bucknell University.
FIA is responsible for monitoring the status and trends in forested ecosystems throughout the US. As part of UFDS, students work on research questions generated by the FIA program and collaborate directly with research statisticians and foresters at FIA. With the rise of new data sources, such as satellite imagery and large scale photography, and with the explosion of new statistical learning tools, a wealth of estimation techniques are available to consider. But with these new methods also come a load of important statistical questions related to robustness, bias, efficiency, and more!
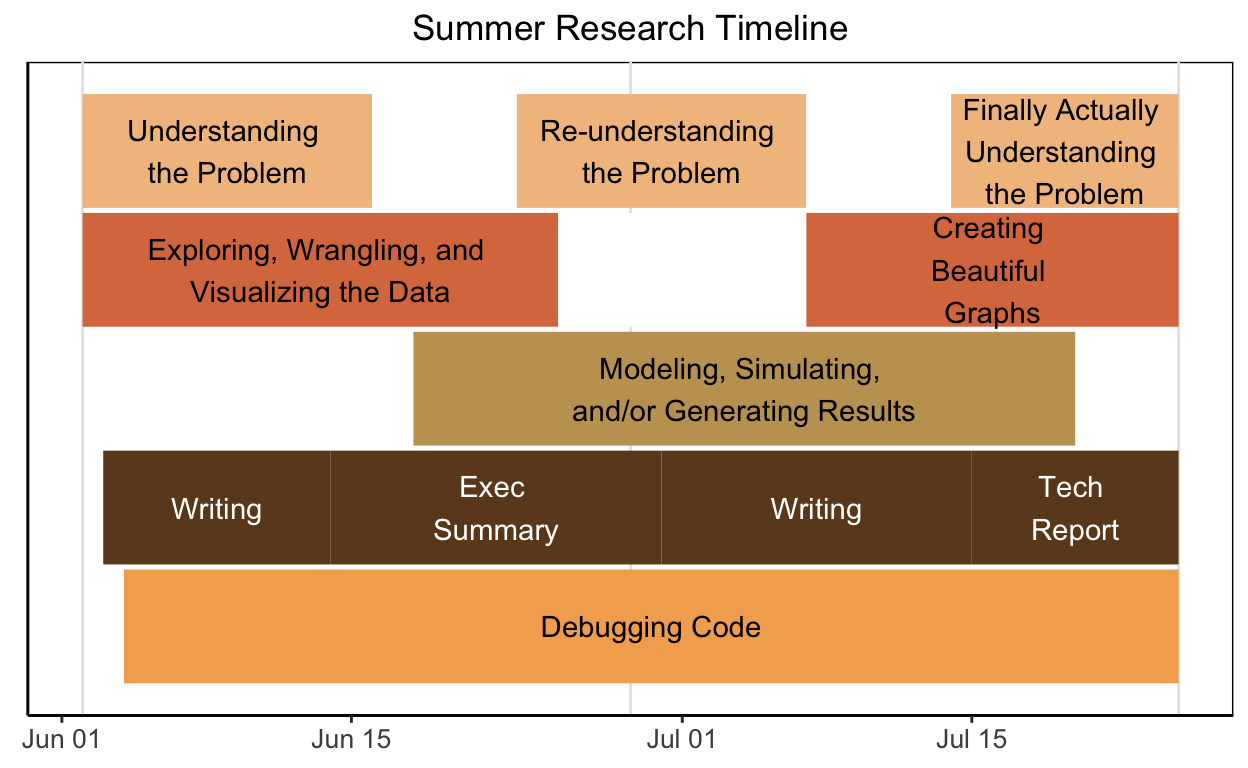
Here’s a rough timeline of the summer research process:
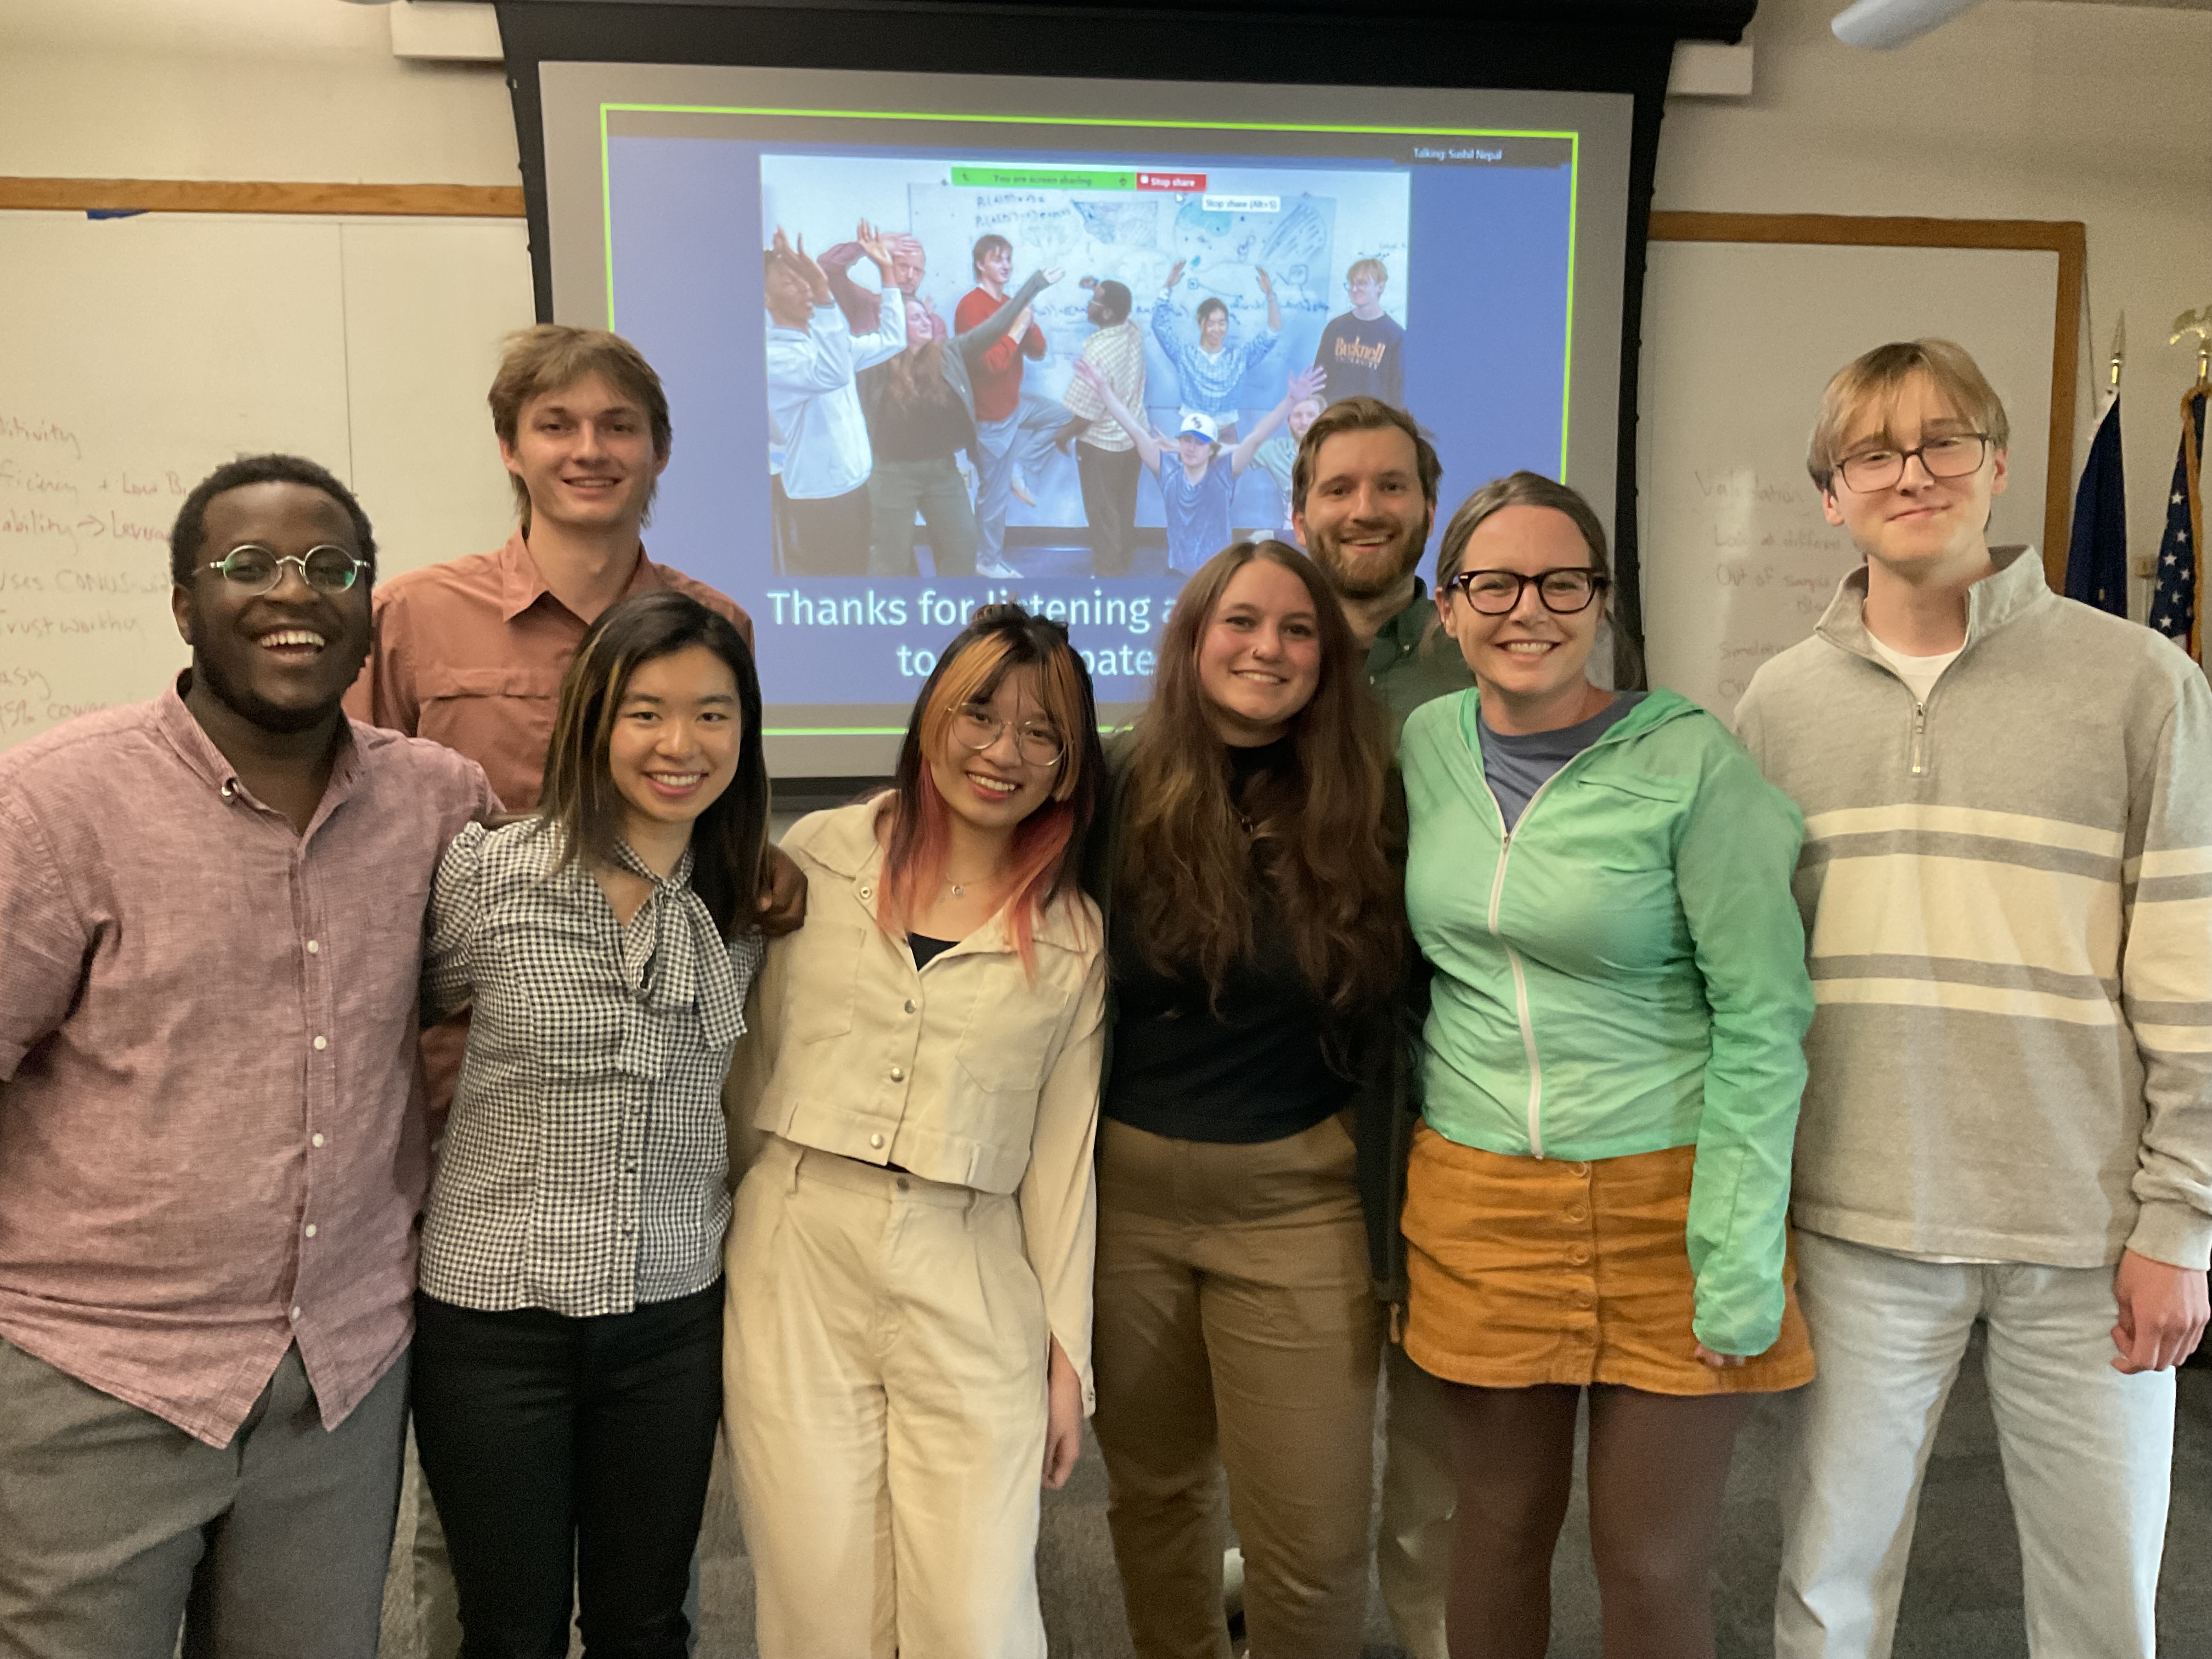
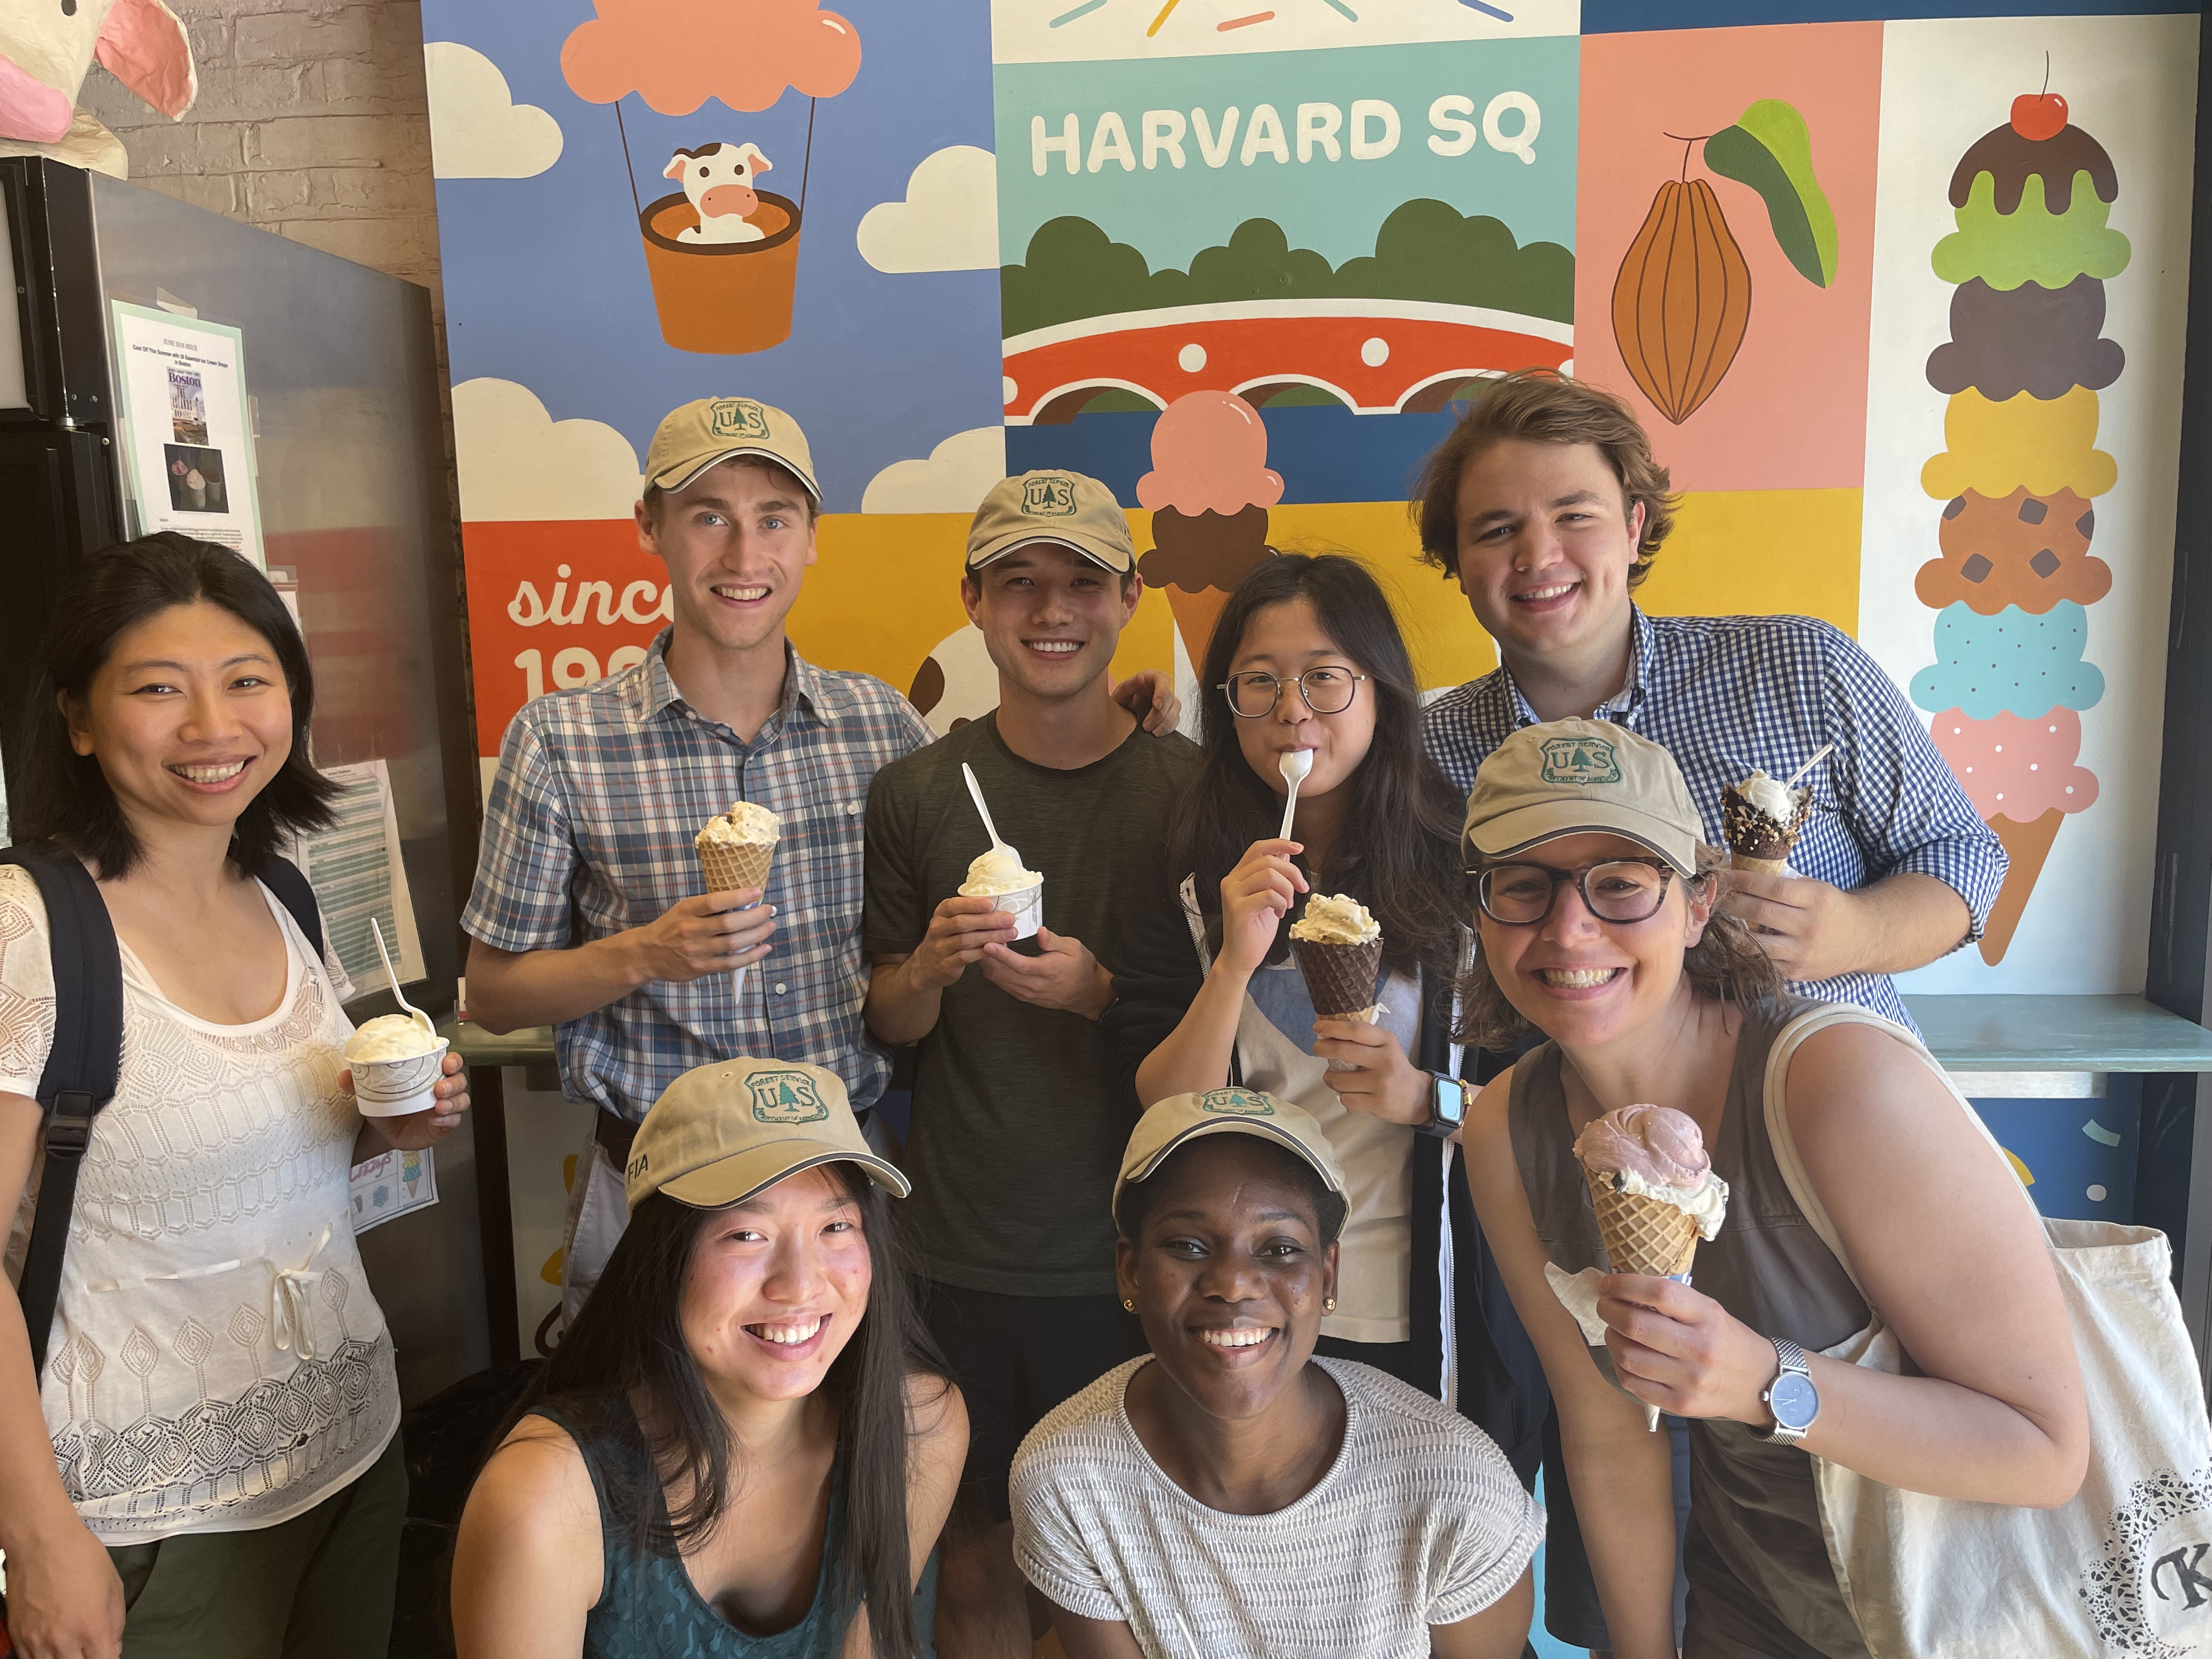
In addition to the activities listed in the research timeline, we also give presentations about our work and eat ice cream!